How to Deploy a Scalable Node.js App Using GitHub Actions and Docker on Cloudways

In today’s fast-paced development environment, automating deployments and ensuring scalability are key factors in delivering robust web applications. If you’re working with Node.js and want a hassle-free cloud deployment experience, Cloudways offers an outstanding managed cloud hosting solution that takes care of performance, scalability, and security.
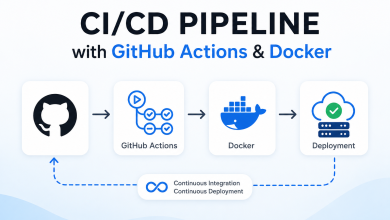
In this guide, we’ll walk you through deploying a Node.js application using Docker and automating the deployment process with GitHub Actions – all hosted on Cloudways.
💡 Try Cloudways with a free trial: Get Started Here
Why Cloudways?
Cloudways is a managed hosting platform built for developers and agencies. It sits on top of leading cloud providers like DigitalOcean, AWS, and Google Cloud, offering a simplified dashboard and powerful tools for deploying and managing web apps.
Top Reasons to Use Cloudways:
- Managed servers with SSH/SFTP access
- Built-in server-level caching (Varnish, Redis, Memcached)
- 24/7 support
- One-click staging environments
- Easy scaling
- Free SSL certificates
✅ Ideal for DevOps workflows with Docker and Git-based deployments
Prerequisites
To follow this tutorial, make sure you have the following:
- A Node.js application
- A GitHub repository
- A Dockerfile in your app root
- A Cloudways account (You can sign up here)
Step 1: Preparing the Node.js Application
Here’s a basic app.js:
const express = require('express');
const app = express();
const PORT = process.env.PORT || 3000;

app.get('/', (req, res) => {
  res.send('Hello from Cloudways!');
});

app.listen(PORT, () => {
  console.log(`App is running on port ${PORT}`);
});
And your package.json:
{
  "name": "cloudways-node-app",
  "version": "1.0.0",
  "main": "app.js",
  "scripts": {
    "start": "node app.js"
  },
  "dependencies": {
    "express": "^4.17.1"
  }
}
Step 2: Dockerize the App
Create a Dockerfile:
FROM node:18

WORKDIR /app

COPY package*.json ./
RUN npm install

COPY . .

EXPOSE 3000
CMD ["npm", "start"]
Create .dockerignore:
node_modules
npm-debug.log
Step 3: Push Code to GitHub
Initialize your Git repository and push it:
git init
git remote add origin https://github.com/your-username/your-repo.git
git add .
git commit -m "Initial commit"
git push -u origin master
Step 4: Setup a Cloudways Server
- Log in to your Cloudways Dashboard.
- Launch a server (choose DigitalOcean or AWS as base).
- Select Custom App (PHP) for flexibility.
- Note your public IP and SSH credentials.
Although Cloudways doesn’t natively support Docker, you can SSH into your server and install Docker manually.
sudo apt update
sudo apt install docker.io -y
sudo systemctl enable docker
sudo systemctl start docker
Step 5: Configure GitHub Actions for CI/CD
In your project, create a .github/workflows/deploy.yml file:
name: Deploy to Cloudways

on:
  push:
    branches:
      - master

jobs:
  deploy:
    runs-on: ubuntu-latest

    steps:
    - name: Checkout Code
      uses: actions/checkout@v2

    - name: Set up SSH
      uses: webfactory/ssh-agent@v0.5.4
      with:
        ssh-private-key: ${{ secrets.SSH_PRIVATE_KEY }}

    - name: Copy Files to Cloudways
      run: |
        ssh user@CLOUDWAYS_IP "docker stop nodeapp || true && docker rm nodeapp || true"
        scp -r . user@CLOUDWAYS_IP:/home/master/app
        ssh user@CLOUDWAYS_IP "cd /home/master/app && docker build -t nodeapp . && docker run -d -p 3000:3000 --name nodeapp nodeapp"
Make sure you set your SSH_PRIVATE_KEY secret in your GitHub repo.
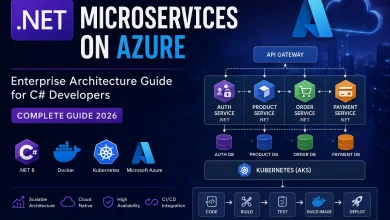
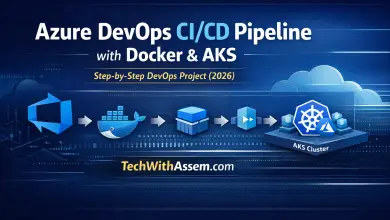
if you looks for Projects for Git-hub Actions you can Read this Deploying a .NET Core App with Docker and GitHub Actions on Azure – Complete CI/CD Pipeline
Step 6: Verify the Deployment
Once your CI/CD pipeline runs, you should be able to access your Node.js app by visiting:
http://<Your-Cloudways-IP>:3000Optional: Add NGINX Reverse Proxy
To make your app accessible on port 80 or 443:
sudo apt install nginxCreate a config:
sudo nano /etc/nginx/sites-available/nodeappserver {
listen 80;
server_name yourdomain.com;
location / {
proxy_pass http://localhost:3000;
proxy_http_version 1.1;
proxy_set_header Upgrade $http_upgrade;
proxy_set_header Connection 'upgrade';
proxy_set_header Host $host;
proxy_cache_bypass $http_upgrade;
}
}Enable it:
sudo ln -s /etc/nginx/sites-available/nodeapp /etc/nginx/sites-enabled/
sudo nginx -t
sudo systemctl restart nginx
Conclusion
You now have a fully automated, scalable Node.js application running on Cloudways, deployed using Docker and GitHub Actions. This setup provides a real-world DevOps experience while keeping infrastructure management simple.
If you’re looking for a powerful, affordable, and scalable hosting provider that integrates beautifully with your DevOps pipelines, Cloudways is the way to go.
🎁 Try Cloudways and get started today: Use this link to claim your free trial