Advanced DevOps Project: Full CI/CD Pipeline on Azure with Terraform, Docker, and Ansible (Complete 2026 Guide)
In today’s fast-paced cloud-native world, DevOps engineers aren’t just managing servers anymore—they’re architecting entire ecosystems. Companies like Netflix, Uber, and Amazon deploy hundreds of changes per day without breaking production. How? With advanced CI/CD pipelines like the one you’ll build in this guide.
Here’s the reality: If you walk into a DevOps interview and say “I know Docker,” you’ll lose to someone who can say “I built a complete CI/CD pipeline on Azure using Terraform, Docker, GitHub Actions, and Ansible.”
This project does exactly that.
By the end of this tutorial, you’ll have built a resilient, scalable, and production-grade DevOps workflow that demonstrates mastery across:
- Terraform — Infrastructure as Code (IaC)
- Docker — Containerization
- GitHub Actions — Continuous Integration & Deployment
- Ansible — Configuration Management
- Prometheus & Grafana — Monitoring & Alerting
This is the kind of project that gets DevOps engineers hired.
Prerequisites: What You Need Before Starting
Before diving in, make sure you have:
✅ Azure Account — with $200 free credits (create one at azure.com)
✅ GitHub Account — for version control and Actions
✅ Local Machine Setup:
- Terraform CLI installed (v1.3+)
- Docker Desktop installed
- Git installed
- Azure CLI installed (
az loginshould work) - Ansible installed (pip install ansible)
✅ Basic Knowledge:
- Understanding of Linux commands
- Familiarity with Git/GitHub
- Basic understanding of networking (ports, IPs, VNets)
- Node.js and React basics (for the sample app)
✅ Estimated Time: 4-6 hours for complete setup
If you’re missing any of these, don’t skip this step—it’ll save you hours of debugging later.
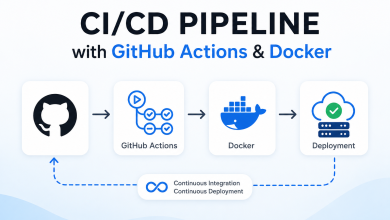
Architecture Overview: What You’re Building
Let’s visualize the complete DevOps pipeline you’ll create:
GitHub Repository (Source Code)
    ↓
GitHub Actions (CI/CD Trigger)
    ↓
    ├─→ Build Docker Images (Frontend + Backend)
    ├─→ Push to Azure Container Registry (ACR)
    ├─→ Run Terraform (Provision Infrastructure)
    └─→ Run Ansible (Configure VMs)
    ↓
Azure Infrastructure
    ├─→ Virtual Network (VNet) with Subnets
    ├─→ Network Security Groups (NSGs)
    ├─→ Azure Container Registry (ACR)
    ├─→ Virtual Machines (Ubuntu)
    ├─→ Load Balancer (distribute traffic)
    └─→ Monitoring Stack (Prometheus + Grafana)
    ↓
Running Application
    ├─→ Frontend Container (React on Nginx)
    ├─→ Backend Container (Node.js/Express)
    ├─→ Database Container (MongoDB)
    └─→ Monitoring Containers (Prometheus + Grafana)
What happens when you push code:
- GitHub Actions automatically triggers
- Builds fresh Docker images
- Pushes them to Azure Container Registry
- Terraform updates infrastructure (if needed)
- Ansible configures servers and deploys containers
- Prometheus collects metrics
- Grafana displays real-time dashboards
- Your application is live—no manual steps required
Step 1: Provisioning Azure Infrastructure with Terraform
This is where Infrastructure as Code (IaC) shines. Instead of clicking through the Azure portal, you’ll define everything in code.
1.1 Create Your Terraform Project Structure
infrastructure/
├── main.tf
├── variables.tf
├── outputs.tf
├── terraform.tfvars
└── modules/
    ├── networking/
    ├── compute/
    └── registry/
1.2 Configure the Azure Provider
Create main.tf:
terraform {
  required_providers {
    azurerm = {
      source  = "hashicorp/azurerm"
      version = "~> 3.0"
    }
  }
}

provider "azurerm" {
  features {}
}

# Create Resource Group
resource "azurerm_resource_group" "rg" {
  name     = var.resource_group_name
  location = var.azure_region
}
Create variables.tf:
variable "resource_group_name" {
  default = "devops-rg-prod"
}

variable "azure_region" {
  default = "East US"
}

variable "app_name" {
  default = "devops-app"
}

variable "environment" {
  default = "production"
}
1.3 Create Virtual Network with Subnets
Add to main.tf:
# Virtual Network
resource "azurerm_virtual_network" "vnet" {
  name                = "${var.app_name}-vnet"
  address_space       = ["10.0.0.0/16"]
  location            = azurerm_resource_group.rg.location
  resource_group_name = azurerm_resource_group.rg.name
}

# Subnet for Web Servers
resource "azurerm_subnet" "web_subnet" {
  name                 = "web-subnet"
  resource_group_name  = azurerm_resource_group.rg.name
  virtual_network_name = azurerm_virtual_network.vnet.name
  address_prefixes     = ["10.0.1.0/24"]
}

# Subnet for Monitoring
resource "azurerm_subnet" "monitoring_subnet" {
  name                 = "monitoring-subnet"
  resource_group_name  = azurerm_resource_group.rg.name
  virtual_network_name = azurerm_virtual_network.vnet.name
  address_prefixes     = ["10.0.2.0/24"]
}
1.4 Create Network Security Groups (NSGs)
# NSG for Web Servers
resource "azurerm_network_security_group" "web_nsg" {
  name                = "${var.app_name}-web-nsg"
  location            = azurerm_resource_group.rg.location
  resource_group_name = azurerm_resource_group.rg.name

  # Allow HTTP
  security_rule {
    name                       = "AllowHTTP"
    priority                   = 100
    direction                  = "Inbound"
    access                     = "Allow"
    protocol                   = "Tcp"
    source_port_range          = "*"
    destination_port_range     = "80"
    source_address_prefix      = "*"
    destination_address_prefix = "*"
  }

  # Allow HTTPS
  security_rule {
    name                       = "AllowHTTPS"
    priority                   = 110
    direction                  = "Inbound"
    access                     = "Allow"
    protocol                   = "Tcp"
    source_port_range          = "*"
    destination_port_range     = "443"
    source_address_prefix      = "*"
    destination_address_prefix = "*"
  }

  # Allow SSH (only from your IP)
  security_rule {
    name                       = "AllowSSH"
    priority                   = 120
    direction                  = "Inbound"
    access                     = "Allow"
    protocol                   = "Tcp"
    source_port_range          = "*"
    destination_port_range     = "22"
    source_address_prefix      = "YOUR_IP_HERE/32"  # Change this
    destination_address_prefix = "*"
  }
}
1.5 Create Azure Container Registry (ACR)
resource "azurerm_container_registry" "acr" {
  name                = "${replace(var.app_name, "-", "")}acr"
  location            = azurerm_resource_group.rg.location
  resource_group_name = azurerm_resource_group.rg.name
  sku                 = "Standard"
  admin_enabled       = true
}
1.6 Initialize and Apply Terraform
cd infrastructure
terraform init
terraform plan  # Review changes
terraform apply  # Deploy to Azure
⚠️ Common Terraform Mistakes:
- ❌ Forgetting to set
YOUR_IP_HEREin NSG rules → can’t SSH into VMs - ❌ Using weak naming → conflicts with existing resources
- ❌ Not storing
terraform.tfstatesecurely → security risk - ✅ Solution: Store tfstate in Azure Storage backend (we’ll cover this in advanced topics)
Step 2: Containerizing Your Application with Docker
Now that infrastructure is ready, let’s package the application.
2.1 Backend Dockerfile (Node.js/Express API)
Create backend/Dockerfile:
# Build stage
FROM node:18-alpine as builder
WORKDIR /app
COPY package*.json ./
RUN npm ci --only=production
# Runtime stage
FROM node:18-alpine
WORKDIR /app
# Create non-root user for security
RUN addgroup -g 1001 -S nodejs && adduser -S nodejs -u 1001
COPY /app/node_modules ./node_modules
COPY . .
USER nodejs
EXPOSE 3000
HEALTHCHECK \
CMD node -e "require('http').get('http://localhost:3000/health', (r) => {if (r.statusCode !== 200) throw new Error(r.statusCode)})"
CMD ["node", "server.js"]Why this structure?
- Multi-stage build → smaller final image (removes build dependencies)
- Non-root user → better security (doesn’t run as root)
- Health check → Kubernetes/Docker knows if app is healthy
2.2 Frontend Dockerfile (React + Nginx)
Create frontend/Dockerfile:
# Build stage
FROM node:18-alpine as builder
WORKDIR /app
COPY package*.json ./
RUN npm ci
COPY . .
RUN npm run build
# Runtime stage - Nginx
FROM nginx:alpine
COPY /app/build /usr/share/nginx/html
COPY nginx.conf /etc/nginx/conf.d/default.conf
EXPOSE 80
CMD ["nginx", "-g", "daemon off;"]Create frontend/nginx.conf:
server {
    listen 80;
    server_name _;

    root /usr/share/nginx/html;
    index index.html;

    location / {
        try_files $uri /index.html;
    }

    location /api {
        proxy_pass http://backend:3000;
        proxy_set_header Host $host;
        proxy_set_header X-Real-IP $remote_addr;
    }
}
2.3 Build and Test Locally
# Build images
docker build -t my-backend:1.0 ./backend
docker build -t my-frontend:1.0 ./frontend

# Run with Docker Compose (for testing)
docker-compose up -d

# Test endpoints
curl http://localhost:3000/api/health
curl http://localhost:80
Step 3: Setting Up GitHub Actions CI/CD Pipeline
This is where automation magic happens. Every code push automatically builds, tests, and deploys.
3.1 Create GitHub Actions Workflow
Create .github/workflows/deploy.yml:
name: Advanced CI/CD Pipeline

on:
  push:
    branches: [ main, develop ]
  pull_request:
    branches: [ main ]

env:
  AZURE_REGION: East US
  ACR_NAME: myacr  # Change this

jobs:

  # Job 1: Build and Push Docker Images
  build:
    runs-on: ubuntu-latest
    outputs:
      image-tag: ${{ steps.meta.outputs.tags }}

    steps:
    - name: Checkout Code
      uses: actions/checkout@v3
      with:
        fetch-depth: 0  # Full history for versioning

    - name: Set up Docker Buildx
      uses: docker/setup-buildx-action@v2

    - name: Log in to Azure
      uses: azure/login@v1
      with:
        creds: ${{ secrets.AZURE_CREDENTIALS }}

    - name: Log in to ACR
      run: |
        az acr login --name ${{ env.ACR_NAME }}

    - name: Generate Image Tag
      id: meta
      run: |
        echo "tags=${{ env.ACR_NAME }}.azurecr.io/backend:$(git rev-parse --short HEAD)" >> $GITHUB_OUTPUT
        echo "tags=${{ env.ACR_NAME }}.azurecr.io/frontend:$(git rev-parse --short HEAD)" >> $GITHUB_OUTPUT

    - name: Build and Push Backend
      run: |
        docker build -t ${{ env.ACR_NAME }}.azurecr.io/backend:$(git rev-parse --short HEAD) ./backend
        docker push ${{ env.ACR_NAME }}.azurecr.io/backend:$(git rev-parse --short HEAD)

    - name: Build and Push Frontend
      run: |
        docker build -t ${{ env.ACR_NAME }}.azurecr.io/frontend:$(git rev-parse --short HEAD) ./frontend
        docker push ${{ env.ACR_NAME }}.azurecr.io/frontend:$(git rev-parse --short HEAD)

  # Job 2: Terraform Infrastructure
  terraform:
    needs: build
    runs-on: ubuntu-latest
    if: github.ref == 'refs/heads/main'  # Only on main branch

    steps:
    - name: Checkout Code
      uses: actions/checkout@v3

    - name: Setup Terraform
      uses: hashicorp/setup-terraform@v2
      with:
        terraform_version: 1.5.0

    - name: Terraform Init
      run: |
        cd infrastructure
        terraform init -backend-config="key=terraform.tfstate"

    - name: Terraform Plan
      run: |
        cd infrastructure
        terraform plan -out=tfplan

    - name: Terraform Apply
      if: github.event_name == 'push'
      run: |
        cd infrastructure
        terraform apply -auto-approve tfplan

  # Job 3: Ansible Configuration
  configure:
    needs: terraform
    runs-on: ubuntu-latest
    if: github.ref == 'refs/heads/main'

    steps:
    - name: Checkout Code
      uses: actions/checkout@v3

    - name: Set Up Python for Ansible
      uses: actions/setup-python@v4
      with:
        python-version: '3.10'

    - name: Install Ansible
      run: |
        pip install ansible azure-cli-core

    - name: Log in to Azure
      uses: azure/login@v1
      with:
        creds: ${{ secrets.AZURE_CREDENTIALS }}

    - name: Get VM IPs from Terraform
      run: |
        cd infrastructure
        terraform output -raw web_servers_ips > ../ansible/inventory.txt

    - name: Run Ansible Playbook
      run: |
        cd ansible
        ansible-playbook -i inventory.txt -u azureuser --private-key=${{ secrets.VM_PRIVATE_KEY }} deploy.yml

  # Job 4: Run Tests (Optional but recommended)
  test:
    runs-on: ubuntu-latest

    steps:
    - name: Checkout Code
      uses: actions/checkout@v3

    - name: Set up Node.js
      uses: actions/setup-node@v3
      with:
        node-version: '18'

    - name: Install Backend Dependencies
      run: cd backend && npm ci

    - name: Run Backend Tests
      run: cd backend && npm test

    - name: Install Frontend Dependencies
      run: cd frontend && npm ci

    - name: Run Frontend Tests
      run: cd frontend && npm test
3.2 Add Secrets to GitHub
Go to your GitHub repository → Settings → Secrets and add:
AZURE_CREDENTIALS = (from az ad sp create-for-rbac --role owner --scopes /subscriptions/{id})
VM_PRIVATE_KEY = (your SSH private key)
3.3 How the Pipeline Works
Git Push → GitHub detects push →
  → Builds Docker images →
    → Pushes to ACR →
      → Runs Terraform (infrastructure) →
        → Runs Ansible (configuration) →
          → Tests run in parallel →
            → Application is live
Everything happens automatically. You just push code.
Step 4: Automating Server Configuration with Ansible
Once Terraform creates VMs, Ansible configures them without manual SSH.
4.1 Create Ansible Inventory
Create ansible/inventory.ini:
[webservers]
web1 ansible_host=10.0.1.4 ansible_user=azureuser ansible_ssh_private_key_file=~/.ssh/azure_vm_key
web2 ansible_host=10.0.1.5 ansible_user=azureuser ansible_ssh_private_key_file=~/.ssh/azure_vm_key

[monitoring]
monitor ansible_host=10.0.2.4 ansible_user=azureuser ansible_ssh_private_key_file=~/.ssh/azure_vm_key

[all:vars]
ansible_python_interpreter=/usr/bin/python3
4.2 Create Ansible Playbook
Create ansible/deploy.yml:
---
- name: Deploy DevOps Application
  hosts: webservers
  become: yes
  gather_facts: yes

  vars:
    docker_users: [ azureuser ]
    acr_server: myacr.azurecr.io
    acr_username: "{{ lookup('env', 'ACR_USERNAME') }}"
    acr_password: "{{ lookup('env', 'ACR_PASSWORD') }}"

  tasks:

    # Update system
    - name: Update apt cache
      apt:
        update_cache: yes
        cache_valid_time: 3600

    # Install Docker
    - name: Install Docker dependencies
      apt:
        name:
          - apt-transport-https
          - ca-certificates
          - curl
          - gnupg
          - lsb-release
        state: present

    - name: Add Docker GPG key
      apt_key:
        url: https://download.docker.com/linux/ubuntu/gpg
        state: present

    - name: Add Docker repository
      apt_repository:
        repo: "deb [arch=amd64] https://download.docker.com/linux/ubuntu {{ ansible_distribution_release }} stable"
        state: present

    - name: Install Docker
      apt:
        name:
          - docker-ce
          - docker-ce-cli
          - containerd.io
          - docker-buildx-plugin
          - docker-compose-plugin
        state: present
        update_cache: yes

    - name: Start Docker service
      systemd:
        name: docker
        state: started
        enabled: yes

    - name: Add user to docker group
      user:
        name: "{{ item }}"
        groups: docker
        append: yes
      loop: "{{ docker_users }}"

    # Docker login to ACR
    - name: Log in to Azure Container Registry
      shell: |
        echo "{{ acr_password }}" | docker login -u "{{ acr_username }}" --password-stdin "{{ acr_server }}"
      environment:
        ACR_SERVER: "{{ acr_server }}"

    # Pull and run containers
    - name: Pull backend image
      docker_image:
        name: "{{ acr_server }}/backend:latest"
        source: pull
        state: present

    - name: Pull frontend image
      docker_image:
        name: "{{ acr_server }}/frontend:latest"
        source: pull
        state: present

    - name: Run backend container
      docker_container:
        name: backend
        image: "{{ acr_server }}/backend:latest"
        state: started
        restart_policy: always
        ports:
          - "3000:3000"
        env:
          DATABASE_URL: "mongodb://mongo:27017/app"
          NODE_ENV: "production"
        networks:
          - name: app-network

    - name: Run frontend container
      docker_container:
        name: frontend
        image: "{{ acr_server }}/frontend:latest"
        state: started
        restart_policy: always
        ports:
          - "80:80"
        networks:
          - name: app-network

    - name: Run MongoDB container
      docker_container:
        name: mongo
        image: mongo:latest
        state: started
        restart_policy: always
        ports:
          - "27017:27017"
        volumes:
          - /data/db:/data/db
        networks:
          - name: app-network

    # Install Node Exporter for monitoring
    - name: Create prometheus user
      user:
        name: prometheus
        shell: /bin/false
        home: /etc/prometheus

    - name: Download Node Exporter
      get_url:
        url: "https://github.com/prometheus/node_exporter/releases/download/v1.6.1/node_exporter-1.6.1.linux-amd64.tar.gz"
        dest: /tmp/node_exporter.tar.gz
        mode: '0644'

    - name: Extract Node Exporter
      unarchive:
        src: /tmp/node_exporter.tar.gz
        dest: /usr/local/bin/
        extra_opts: ["--strip-components=1"]
        remote_src: yes

    - name: Create Node Exporter systemd service
      copy:
        content: |
          [Unit]
          Description=Node Exporter
          After=network.target

          [Service]
          Type=simple
          User=prometheus
          ExecStart=/usr/local/bin/node_exporter

          [Install]
          WantedBy=multi-user.target
        dest: /etc/systemd/system/node_exporter.service

    - name: Start Node Exporter
      systemd:
        name: node_exporter
        state: started
        enabled: yes
        daemon_reload: yes

- name: Setup Monitoring Stack
  hosts: monitoring
  become: yes
  gather_facts: yes

  tasks:
    - name: Update apt cache
      apt:
        update_cache: yes
        cache_valid_time: 3600

    # Install Prometheus
    - name: Create prometheus group
      group:
        name: prometheus
        state: present

    - name: Create prometheus user
      user:
        name: prometheus
        group: prometheus
        shell: /bin/false

    - name: Download Prometheus
      get_url:
        url: "https://github.com/prometheus/prometheus/releases/download/v2.48.0/prometheus-2.48.0.linux-amd64.tar.gz"
        dest: /tmp/prometheus.tar.gz

    - name: Create Prometheus directories
      file:
        path: "{{ item }}"
        state: directory
        owner: prometheus
        group: prometheus
      loop:
        - /etc/prometheus
        - /var/lib/prometheus

    - name: Extract Prometheus
      unarchive:
        src: /tmp/prometheus.tar.gz
        dest: /tmp/
        remote_src: yes

    - name: Copy Prometheus binary
      copy:
        src: /tmp/prometheus-2.48.0.linux-amd64/prometheus
        dest: /usr/local/bin/prometheus
        mode: '0755'
        remote_src: yes

    - name: Create Prometheus config
      copy:
        content: |
          global:
            scrape_interval: 15s
            evaluation_interval: 15s

          scrape_configs:
            - job_name: 'webservers'
              static_configs:
                - targets: ['10.0.1.4:9100', '10.0.1.5:9100']

            - job_name: 'prometheus'
              static_configs:
                - targets: ['localhost:9090']
        dest: /etc/prometheus/prometheus.yml
        owner: prometheus
        group: prometheus

    - name: Create Prometheus systemd service
      copy:
        content: |
          [Unit]
          Description=Prometheus
          After=network.target

          [Service]
          Type=simple
          User=prometheus
          ExecStart=/usr/local/bin/prometheus --config.file=/etc/prometheus/prometheus.yml

          [Install]
          WantedBy=multi-user.target
        dest: /etc/systemd/system/prometheus.service

    - name: Start Prometheus
      systemd:
        name: prometheus
        state: started
        enabled: yes
        daemon_reload: yes

    # Install Grafana
    - name: Add Grafana repository
      apt_repository:
        repo: "deb https://packages.grafana.com/oss/deb stable main"
        state: present

    - name: Add Grafana GPG key
      apt_key:
        url: https://packages.grafana.com/gpg.key
        state: present

    - name: Install Grafana
      apt:
        name: grafana-server
        state: present
        update_cache: yes

    - name: Start Grafana
      systemd:
        name: grafana-server
        state: started
        enabled: yes

    - name: Output Monitoring Access
      debug:
        msg:
          - "Prometheus: http://{{ ansible_default_ipv4.address }}:9090"
          - "Grafana: http://{{ ansible_default_ipv4.address }}:3000"
          - "Grafana default credentials: admin / admin"
4.4 Run Ansible Playbook Manually (for testing)
ansible-playbook -i ansible/inventory.ini ansible/deploy.yml -vStep 5: Monitoring with Prometheus & Grafana
Real-world applications need visibility. Here’s how to set up monitoring.
5.1 Access Prometheus
Once Ansible runs, SSH into the monitoring VM:
# SSH into monitoring VM
ssh -i ~/.ssh/azure_vm_key azureuser@<monitoring-vm-ip>

# Prometheus runs on port 9090
# Visit: http://<monitoring-vm-ip>:9090
Verify metrics are being collected:
- Go to http://your-monitoring-ip:9090
- Query tab → Type
node_cpu_seconds_total - Click “Execute” → should see metrics from all web servers
5.2 Setup Grafana Dashboards
# SSH into monitoring VM
ssh -i ~/.ssh/azure_vm_key azureuser@<monitoring-vm-ip>

# Grafana runs on port 3000
# Visit: http://<monitoring-vm-ip>:3000
# Login: admin / admin (change this!)
Add Prometheus as Data Source:
- Click “Configuration” (gear icon)
- Click “Data Sources”
- Click “Add data source”
- Select “Prometheus”
- URL:
http://localhost:9090 - Click “Save & Test”
Import Pre-built Dashboard:
- Click “+” → “Import”
- Enter Dashboard ID:
1860(Node Exporter for Prometheus) - Select Prometheus data source
- Click “Import”
You now have real-time server metrics!
5.3 Set Up Alerting Rules
Create alerting-rules.yaml:
groups:
  - name: node_alerts
    interval: 30s
    rules:
      - alert: HighCPUUsage
        expr: (100 - (avg by (instance) (irate(node_cpu_seconds_total{mode="idle"}[5m])) * 100)) > 80
        for: 5m
        annotations:
          summary: "High CPU usage on {{ $labels.instance }}"
          description: "CPU usage is {{ $value }}%"

      - alert: HighMemoryUsage
        expr: (1 - (node_memory_MemAvailable_bytes / node_memory_MemTotal_bytes)) * 100 > 85
        for: 5m
        annotations:
          summary: "High memory usage on {{ $labels.instance }}"
          description: "Memory usage is {{ $value }}%"

      - alert: DiskSpaceRunningOut
        expr: (node_filesystem_avail_bytes{fstype!~"tmpfs|fuse.lxcfs|squashfs|vfat"} / node_filesystem_size_bytes) < 0.15
        for: 5m
        annotations:
          summary: "Low disk space on {{ $labels.instance }}"
          description: "Disk space is {{ $value }}%"
Step 6: Advanced DevOps & Security Best Practices
6.1 Infrastructure Security
✅ SSH Key Pair Authentication
# Generate key pair (never use passwords)
ssh-keygen -t rsa -b 4096 -f azure_vm_key
# Store private key securely in GitHub Secrets
✅ Network Isolation (NSGs)
- Only allow port 80/443 from the internet
- Only allow port 22 (SSH) from your IP
- Use Azure Network Watcher for monitoring traffic
✅ Container Registry Security
# Scan images for vulnerabilities
az acr run --registry myacr --cmd 'acr build --image myimage:latest .' .
6.2 CI/CD Security
✅ Secrets Management
# Never commit secrets
# Store in GitHub Secrets → reference as ${{ secrets.NAME }}
# Use short-lived tokens (PATs with expiration)
✅ Branch Protection
- GitHub → Settings → Branches
- Add rule for
mainbranch - Require PR reviews before merge
- Require status checks to pass
6.3 Application Security
✅ Run Containers as Non-Root
RUN addgroup -g 1001 -S nodejs && adduser -S nodejs -u 1001
USER nodejs
✅ Minimal Base Images
# Good: 50MB
FROM node:18-alpine

# Bad: 900MB
FROM node:18-bullseye
✅ Health Checks
HEALTHCHECK \
CMD curl -f http://localhost:3000/health || exit 16.4 Monitoring & Logging
✅ Structured Logging
// Good: JSON logs for Prometheus scraping
console.log(JSON.stringify({
  level: 'info',
  message: 'Request processed',
  duration_ms: 150,
  timestamp: new Date().toISOString()
}));
✅ Metrics Collection
- CPU, Memory, Disk usage
- Application response times
- Error rates
- Request throughput
Common Mistakes & How to Fix Them
❌ Mistake #1: SSH Into VMs Can’t Connect
Problem: “Permission denied (publickey)”
Solutions:
- Verify NSG allows SSH from your IP
az network nsg rule list --resource-group devops-rg --nsg-name devops-web-nsg- Check SSH key permissions
chmod 600 azure_vm_key- Verify Terraform created the public key correctly
terraform output public_key_openssh❌ Mistake #2: Ansible Playbook Fails to Connect
Problem: “Failed to connect to the host via ssh”
Solutions:
- Test connectivity manually
ssh -i ~/.ssh/azure_vm_key azureuser@10.0.1.4 "echo success"- Verify inventory has correct IPs
ansible all -i ansible/inventory.ini -m ping- Check that
azureuserhas sudo access (required forbecome: yes)
az vm run-command invoke --resource-group devops-rg --name web-vm-1 --command-id RunShellScript --scripts "id"❌ Mistake #3: Docker Images Not Pushing to ACR
Problem: “unauthorized: authentication required”
Solutions:
- Verify ACR credentials in GitHub Secrets
az acr credential show --name myacr- Test ACR login locally
   az acr login --name myacr
   docker tag myimage myacr.azurecr.io/myimage:latest
docker push myacr.azurecr.io/myimage:latest- Check ACR exists and is in correct region
az acr list --output table❌ Mistake #4: Containers Can’t Access External Services
Problem: “Connection timeout” when app tries to reach database
Solutions:
- Verify NSG allows outbound traffic
- Check Azure Firewall rules
- Ensure containers are on same Docker network
- Test connectivity from container
docker exec backend curl http://mongo:27017❌ Mistake #5: Prometheus Metrics Not Showing
Problem: “No data available in Grafana”
Solutions:
- Verify Node Exporter is running
curl http://web-vm-ip:9100/metrics- Check Prometheus targets
- Go to Prometheus dashboard
- Status → Targets
- Ensure “UP” status (not “DOWN”)
- Verify firewall allows port 9100
az network nsg rule list --resource-group devops-rg --nsg-name devops-web-nsgReal-World Example: Adding a New Feature
Let’s say you need to add a new API endpoint to the backend:
1. Create feature branch:
git checkout -b feature/new-endpoint2. Add code and commit:
echo 'app.get("/api/users", ...)' >> backend/server.js
git add backend/server.js
git commit -m "feat: add GET /api/users endpoint"
3. Push to GitHub:
git push origin feature/new-endpointWhat happens automatically:
- ✅ GitHub Actions triggers (build job runs)
- ✅ Backend Docker image builds
- ✅ Tests run
- ✅ New image pushes to ACR
- ✅ PR is created (ready for review)
4. After PR approval, merge to main:
# GitHub UI → Merge PRThen:
- ✅ Terraform runs (updates infrastructure if needed)
- ✅ Ansible runs (deploys containers)
- ✅ New endpoint is live in production
- Zero manual steps. All automated.
Cost Breakdown: What Will This Cost?
Monthly costs for this setup:
| Component | Size | Cost/Month |
|---|---|---|
| Virtual Machines (2x B2s) | 2 vCPU, 4GB RAM | $40 |
| Azure Container Registry | Standard | $10 |
| Load Balancer | Basic | $0.025/hour = $18 |
| Network Traffic | ~10GB/month | $5 |
| Storage (NSGs, etc.) | Minimal | $1 |
| Total | ~$74/month |
To reduce costs:
- Use B1s VMs instead (~$20/month each)
- Switch to Free tier Container Registry ($0 for small projects)
- Use Azure Spot Instances (80% cheaper, not for prod)
Next Steps: Scaling This Pipeline
Once you’ve mastered this pipeline, here are advanced topics:
🚀 Kubernetes Instead of VMs
Replace VMs + Docker with Azure Kubernetes Service (AKS):
- Auto-scaling
- Load balancing built-in
- Rolling deployments
- Self-healing
🔒 SSL/HTTPS with Let’s Encrypt
# Use NGINX Ingress with cert-manager
# Auto-renews certificates
📊 Advanced Monitoring
- Log Analytics — centralized logging
- Application Insights — distributed tracing
- Azure Monitor — advanced alerting
🔄 Multi-Region Deployment
- Traffic Manager for geo-routing
- Replication across regions
- Disaster recovery
🤖 Infrastructure Drift Detection
# Detect manual changes to infrastructure
terraform plan -refresh=true
Conclusion: You’ve Built Enterprise DevOps
Congratulations! You’ve created a production-grade DevOps pipeline that demonstrates mastery across the entire stack:
✅ Infrastructure as Code (Terraform)
✅ Containerization (Docker)
✅ CI/CD Automation (GitHub Actions)
✅ Configuration Management (Ansible)
✅ Monitoring & Observability (Prometheus + Grafana)
✅ Security Best Practices
✅ Troubleshooting & Debugging
This project will:
- 🎯 Impress recruiters — shows real DevOps skills
- 💼 Land you interviews — this is what companies actually do
- 📈 Increase your salary — experienced DevOps engineers earn $130k-$180k+
- 🚀 Build your portfolio — show this to everyone
What to do next:
- Document your setup — create a README
- Push to GitHub — make it public (without secrets!)
- Add it to your resume — link to the repo
- Deploy a real application — replace the sample app
- Monitor in production — watch Grafana dashboards
- Customize and extend — add Kubernetes, SSL, logging
The DevOps world needs engineers like you. Go build something amazing. 🚀
FAQ: Questions You Might Have
Q: What if I don’t have an Azure account?
A: You can use AWS (EC2, ECR, CodePipeline) or Google Cloud (Compute Engine, GKE). The concepts are the same.
Q: Can I use a cheaper cloud provider?
A: Yes! DigitalOcean, Linode, or Vultr work too. Just replace Azure Terraform modules.
Q: How do I test this locally before deploying?
A: Use docker-compose locally, then deploy to Azure. This ensures your app works before pushing.
Q: How long until this is production-ready?
A: About 4-6 hours from scratch. With practice, you can do it in 1-2 hours.
Q: What if containers crash in production?
A: Ansible configured them with restart_policy: always, so Docker automatically restarts them. Prometheus alerts you.
Q: How do I rollback a deployment?
A: Push the previous container image tag. GitHub Actions rebuilds and redeploys. Instant rollback.
Q: Can I use this for a real business?
A: Yes! Scale it with AKS or add more VMs. The architecture scales from startup to enterprise.
Read this related articles: